When it comes to observability, Grafana is a fantastic tool that has been my go-to solution for years. As a long-term user of Grafana OSS, I’ve always enjoyed the user experience of the dashboard: it’s so sleek, beautiful, and incredibly customizable.
I’m glad to see that Grafana was recognized by Gartner - “Grafana Labs is a Leader in the 2025 Gartner® Magic Quadrant™ for Observability Platforms”. This is such a well-deserved recognition for a tool that has transformed how we think about monitoring and observability!
The Journey to a Unified Platform
For the longest time, I maintained two separate observability platforms in my homelab and personal projects:
- Grafana for metrics (with InfluxDB as the backend)
- Graylog for logs
Graylog served me well for a long time but it was not fun to maintain two different platforms:
- Switching between different UIs
- Dealing with different query languages
- Double the maintenance overhead
On top of that, I always thought that Graylog was quite complex to set up and maintain. The Elasticsearch backend required significant resources and every upgrade felt like a small adventure. So when I discovered Grafana Loki, it felt like finding the missing piece of my observability puzzle.
What Makes Loki Different?
Loki doesn’t create a massive search index like traditional log aggregation systems! Instead of indexing the entire log content (like Elasticsearch does), Loki only indexes the metadata (labels). The actual log content is compressed and stored in chunks.
This approach promises:
- Significantly lower storage requirements
- Much simpler operations
- Cost-effective
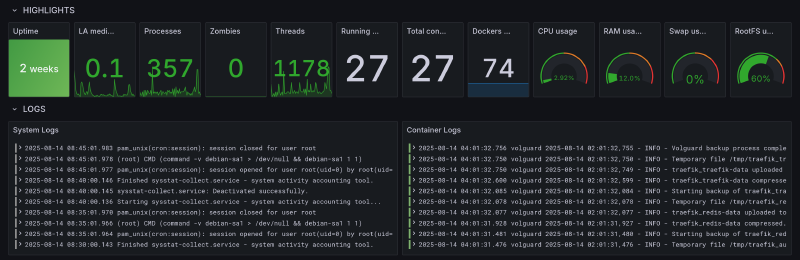
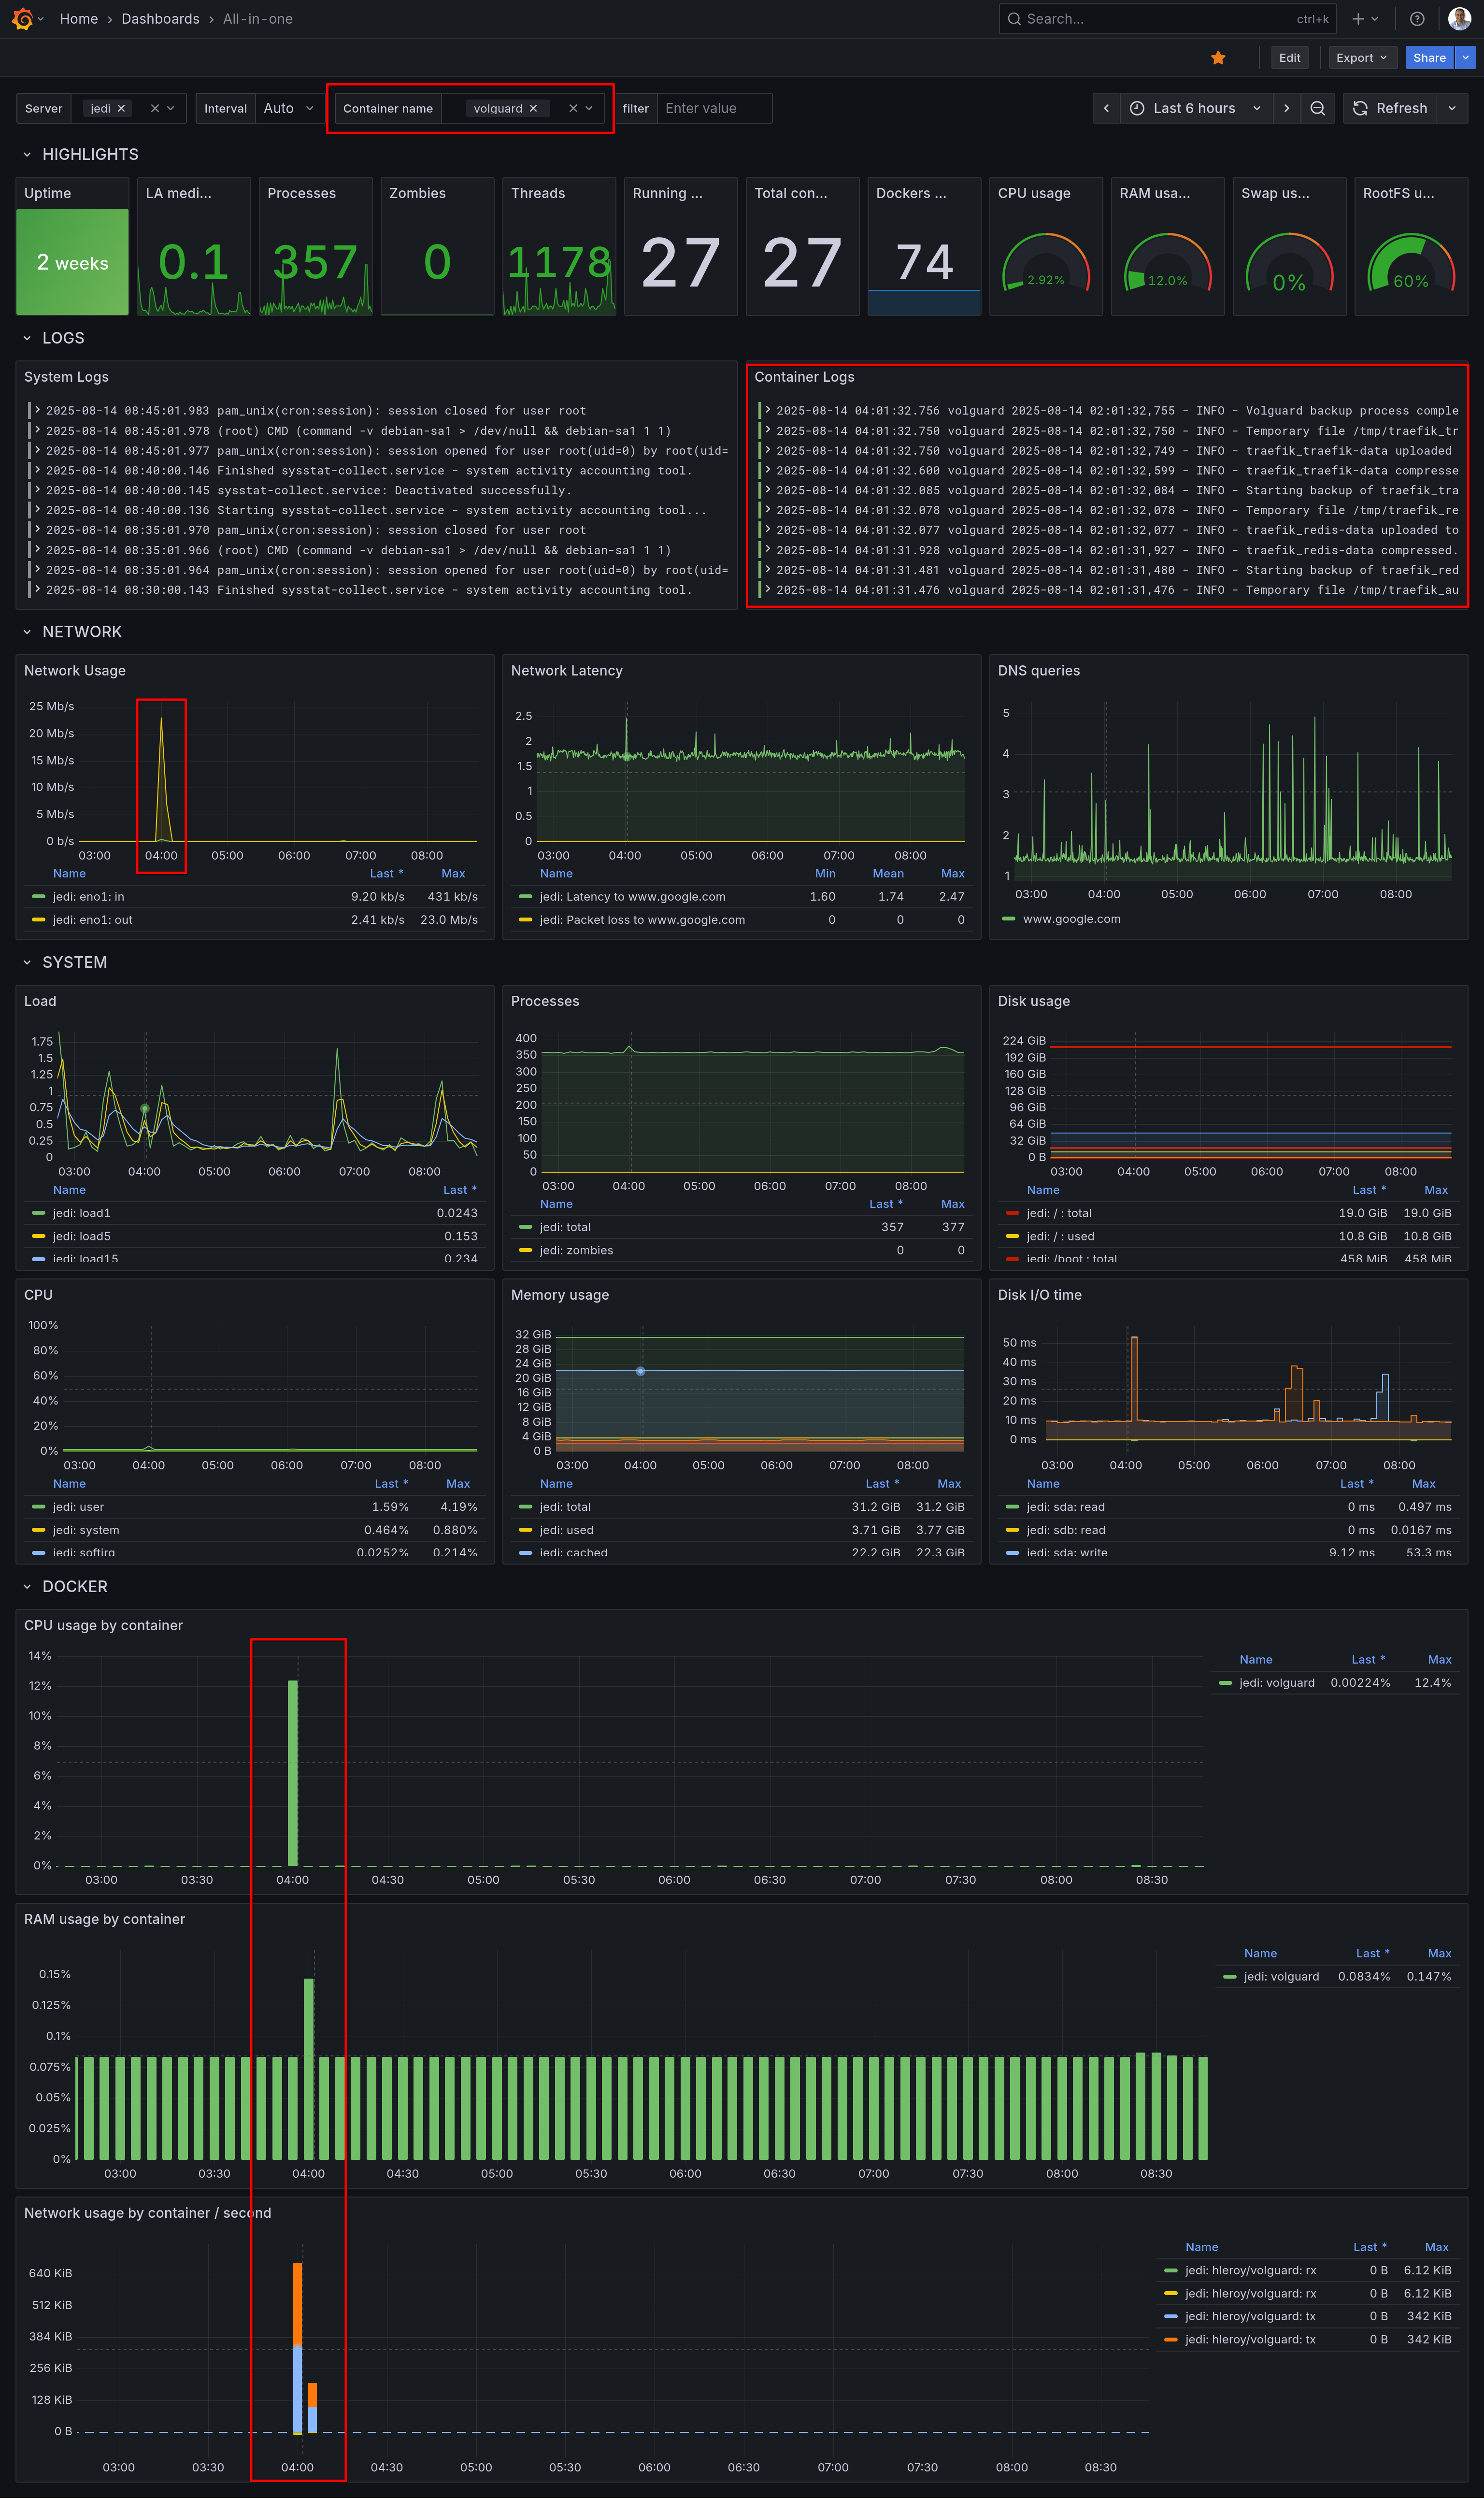
The Power of Unified Dashboards
What I love most about having everything in Grafana now is the ability to create truly unified dashboards. This is the real-life scenario:
- You see a spike in your newtwork trafic
- You zoom on that time range
- Right below, you see the corresponding server and application logs
- You can filter logs with keywords a limit the logs and metrics to a Docker container
- Root cause found in a minute :-)
No more copying timestamps and switching between tabs. It’s all there, beautifully integrated!
My Configuration
I’m sharing below my Promtail configuration which scrapes:
- Traefik logs
- Django application logs
- System logs (using journald)
This gives a full overview of system and application logs for troubleshooting.
promtail.yml
server:
  http_listen_port: 0 # Disable web server, otherwise set to 9080
  grpc_listen_port: 0

positions:
  filename: /tmp/positions.yaml

clients:
  - url: "${LOKI_ENDPOINT}"
    headers:
      X-Token: "${LOKI_AUTHORIZATION}"
    backoff_config:
      min_period: 1s
      max_period: 5m
      max_retries: 10

scrape_configs:
  - job_name: traefik_logs
    static_configs:
      - targets:
          - localhost
        labels:
          job: traefik
          __path__: /logs/access.log
    # Pipeline stages to process and optimize log entries
    # This helps reduce the number of entries and manage rate limits
    pipeline_stages:
      - match:
          selector: '{job="traefik"}'
          stages:
            - json:
                expressions:
                  request_path: RequestPath
                  status_code: DownstreamStatus
                  user_agent: '"request_User-Agent"'
                  client_host: ClientHost
                  request_method: RequestMethod
            # Drop logs where User-Agent contains "Detectify"
            - drop:
                expression: 'user_agent =~ "(?i).*detectify.*"'
            # Drop static files
            - drop:
                expression: 'request_path =~ "(?i)\\.(js|css|png|jpg|jpeg|gif|ico|svg|woff|woff2|ttf|pdf|map)$"'
            # Drop static directories
            - drop:
                expression: 'request_path =~ "^/(static|media|assets|favicon.ico|robots.txt)/"'

  - job_name: django_logs
    static_configs:
      - targets:
          - localhost
        labels:
          job: django
          __path__: /app/logs/*.log
    pipeline_stages:
      - match:
          selector: '{job="django"}'
          stages:
            - regex:
                expression: '^.*/(?P<service>[^/]+)\.log$'
                source: filename
            - labels:
                service:
            - multiline:
                firstline: '^\[\d{4}-\d{2}-\d{2}'
            - regex:
                expression: '^\[(?P<timestamp>\d{4}-\d{2}-\d{2}\s+\d{2}:\d{2}:\d{2})\]\s+\[(?P<level>\w+)\]\s+\[(?P<logger>[^:]+):(?P<line>\d+)\]\s+(?P<message>.*)$'
            - labels:
                level:
                timestamp:
                logger:
                line:

  - job_name: journal
    journal:
      max_age: 12h
      labels:
        job: systemd-journal
    relabel_configs:
      - source_labels: ["__journal__systemd_unit"]
        target_label: "unit"
      - source_labels: ["__journal_container_name"]
        target_label: "container_name"
      - source_labels: ["__journal__hostname"]
        target_label: "hostname"

# Adjusted rate limiting configuration
limits_config:
  readline_rate_enabled: true
  readline_rate: 1000
  readline_burst: 1000
  readline_rate_drop: false
Extract from docker-compose.yml
promtail:
  image: grafana/promtail:latest
  restart: always
  volumes:
    - /var/log/journal:/var/log/journal:ro # Access to journal logs
    - /etc/machine-id:/etc/machine-id # Required for journal reading
    - production_traefik_logs:/logs:ro
    - production_django_logs:/app/logs:ro
    - ./compose/production/promtail/promtail.yml:/etc/promtail/config.yml:ro
  environment:
    - LOKI_ENDPOINT
    - LOKI_AUTHORIZATION
  command: -config.file=/etc/promtail/config.yml -config.expand-env=true
Next Steps: Modernizing the Collection Layer?
While I’m thrilled with having metrics and logs in a single dashboard, I’m still using two different agents to collect metrics (Telegraf) and logs (Promtail). This stems from my historical use of Telegraf as a collection agent and InfluxDB as my metrics backend. This combination, often referred to as the TIG stack (Telegraf, InfluxDB, Grafana) continues to be rock-solid and fairly easy to maintain.
So far, InfluxDB 2 is not planned to be EOL’d. However, Grafana recently announced the EOL of Promtail:
“Promtail is expected to reach EOL on March 2, 2026, afterwards no future support or updates will be provided. All future feature development will occur in Grafana Alloy.”
The upside is that Alloy could potentially replace both Telegraf and Promtail with a single tool, further simplifying my stack. But I don’t know yet how complex this migration would be.
Conclusion
Grafana is a great example of a successful company that managed to build and sustain a complete portfolio with cloud, enterprise, and open-source offerings. They claim on their website that “Open source is at the heart of what we do at Grafana Labs.”
As someone who has benefited immensely from their open-source tools, I can’t thank them enough for staying true to this philosophy. The fact that I can run enterprise-grade observability on my personal projects is simply amazing.
Congratulations Grafana Labs! 🧡 Open Source
I’d love to hear from the community: have any of you made the transition from Telegraf/Promtail to Alloy? Drop a comment below or reach out - your insights or pointers would be invaluable as I plan this migration!